Eclipse Test and Performance Tools Platform (TPTP) provides a comprehensive suite of open source performance-testing and profiling tools, including integrated application monitoring, testing, tracing and profiling log analyzing and static-code analysis tools. The Eclipse Callisto 3.2 release includes version 4.2 of the Eclipse Test & Performance Tools Platform (TPTP). OnJava.com recently featured an introduction to using the tool. TPTP lets you test several aspects of your application's behavior, including memory usage, execution statistics, and test coverage.
Installing TPTP
Open the Remote Update window (Help -> Software Updates -> Find and Install), and select the Callisto Discovery Site. If Callisto Discovery Site is not listed, add a "New Remote Site", and add http://download.eclipse.org/callisto/releases/, to the list and select it. You will have to select the "Charting and Reporting", "Enabling features" and "Testing and Performance" options to install.
Profiling with Eclipse TPTP
Follow these steps to profile an application
References:
Installing TPTP
Open the Remote Update window (Help -> Software Updates -> Find and Install), and select the Callisto Discovery Site. If Callisto Discovery Site is not listed, add a "New Remote Site", and add http://download.eclipse.org/callisto/releases/, to the list and select it. You will have to select the "Charting and Reporting", "Enabling features" and "Testing and Performance" options to install.
Profiling with Eclipse TPTP
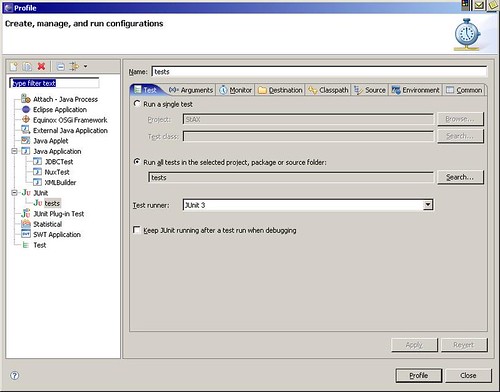
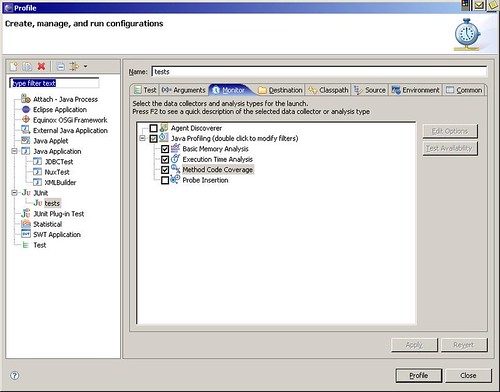
Follow these steps to profile an application
- Create a JUnit test profile using "Run -> Profile" option from the main menu. If you have a test package, it will be automatically selected in the "Test" tab of the profile dialog box.

- Select the "Monitor" tab and choose the required options.

- Click on profile.
References:
- Profiling Your Applications with Eclipse Callisto
- Eclipse Test and Performance Tools Platform
- Introduction: Eclipse Test and Performance Tools Platform (Tutorial)
- Eclipse Test and Performance Tools Platform, Part 1: Test, profile, and monitor applications (Tutorial)
- Eclipse Test and Performance Tools Platform, Part 2: Monitor applications (Tutorial)
No comments:
Post a Comment